The Tcpdump command in Linux is an indispensable network packet analyzer. It allows users to intercept and display TCP/IP and other packets being transmitted or received over a network. This powerful command-line tool is crucial for network troubleshooting, security analysis, and development tasks. Understanding its capabilities can significantly enhance your ability to diagnose and resolve network-related issues efficiently.
Understanding the Tcpdump Command in Linux Basics
The Tcpdump command in Linux serves as a fundamental utility for network administrators and security professionals alike. It operates by capturing raw network traffic directly from a network interface. This raw data is then displayed in a human-readable format, providing insights into various network activities.
The Role of Packet Sniffers in Network Security and Troubleshooting
Packet sniffers, like Tcpdump, are essential tools for observing network communications. They help identify bottlenecks, diagnose connectivity problems, and detect suspicious activities. For instance, a network administrator might use Tcpdump to verify if specific traffic is reaching a server or if an application is communicating correctly.
Furthermore, in a security context, Tcpdump can uncover unauthorized network scans or data exfiltration attempts. It provides a granular view of every packet, making it invaluable for forensic analysis. Therefore, mastering this tool is a significant asset for anyone managing Linux-based networks.
How Tcpdump Captures and Displays Network Traffic
Tcpdump works by putting the network interface into “promiscuous mode,” allowing it to see all traffic on the network segment, not just traffic destined for its own MAC address. Once packets are captured, Tcpdump processes them according to specified filters. It then prints the packet headers or even the full packet contents to the standard output.
This process happens in real-time, offering immediate feedback on network conditions. Users can customize the output extensively, focusing on specific protocols, ports, or hosts. Consequently, it’s a highly flexible tool for diverse analytical needs.
Key Concepts: Interfaces, Promiscuous Mode, and BPF (Berkeley Packet Filter)
To effectively use the Tcpdump command in Linux, understanding these core concepts is vital. An “interface” refers to a network card (e.g., `eth0`, `wlan0`) from which traffic is captured. “Promiscuous mode” is the operational state where the interface captures all packets it sees, regardless of destination.
The “Berkeley Packet Filter” (BPF) is a powerful filtering mechanism that allows Tcpdump to capture only specific types of traffic. BPF expressions are highly efficient, ensuring that only relevant packets are processed and displayed. This significantly reduces the amount of data to sift through, making analysis much faster.
Basic-usage">Getting Started with Tcpdump: Installation and Basic Usage
Before you can leverage the power of the Tcpdump command in Linux, you need to ensure it’s installed on your system. Most modern Linux distributions include Tcpdump in their default repositories, making installation straightforward. This section will guide you through the process and basic command syntax.
Installing the Tcpdump Command on Various Linux Distributions
Installation typically involves using your distribution’s package manager. For Debian/Ubuntu systems, you would use `apt`. On Fedora/CentOS/RHEL, `yum` or `dnf` is the command. Similarly, Arch Linux users would employ `pacman`.
- Debian/Ubuntu: `sudo apt update && sudo apt install tcpdump`
- Fedora/CentOS/RHEL: `sudo dnf install tcpdump` (or `yum` for older versions)
- Arch Linux: `sudo pacman -S tcpdump`
After installation, you can verify its presence by simply typing `tcpdump –version` in your terminal. This confirms that the Tcpdump command in Linux is ready for use.
Basic Tcpdump Syntax: `tcpdump [options] [expression]`
The fundamental syntax for Tcpdump is straightforward. You specify options to control its behavior and expressions to filter the traffic. Without any options or expressions, Tcpdump will attempt to capture all traffic on the default network interface.
For example, running `sudo tcpdump` will start capturing all packets. However, this can quickly overwhelm your terminal with data. Therefore, using specific options and expressions is highly recommended for targeted analysis.
Capturing Traffic from a Specific Network Interface
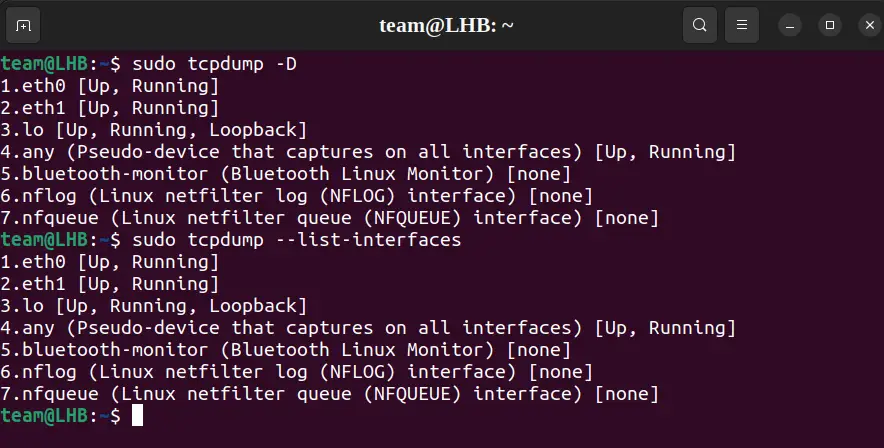
One of the most common initial steps is to specify which network interface to monitor. You can list available interfaces using `tcpdump -D`. Then, use the `-i` option followed by the interface name to select it.
Consider these examples:
- To capture traffic on the `eth0` interface: `sudo tcpdump -i eth0`
- To capture traffic on the `wlan0` interface: `sudo tcpdump -i wlan0`
- To capture traffic on all interfaces: `sudo tcpdump -i any`
This precise targeting helps you focus your analysis on relevant network segments. Furthermore, you can combine this with other options for more refined captures.
Filtering Traffic with Tcpdump: Powerful Options and Expressions
The true power of the Tcpdump command in Linux lies in its ability to filter vast amounts of network traffic. By using specific options and BPF expressions, you can narrow down your capture to only the packets that are relevant to your investigation. This saves time and makes analysis much more manageable.
Host-Based Filtering: Source and Destination IP/MAC Addresses
You can filter traffic based on the source or destination IP address of a host. This is incredibly useful when you want to monitor communication to or from a specific machine. Similarly, filtering by MAC address is possible, though less common.
Here are some practical examples:
- Capture traffic to or from a specific IP address: `sudo tcpdump host 192.168.1.1`
- Capture traffic from a specific source IP: `sudo tcpdump src host 192.168.1.100`
- Capture traffic destined for a specific IP: `sudo tcpdump dst host 192.168.1.200`
These filters allow you to isolate conversations involving particular network devices. This precision is key for effective network diagnostics.
Port-Based Filtering: Capturing Specific Services and Protocols
Filtering by port number allows you to monitor traffic related to specific network services. For example, you can capture web traffic (port 80/443), SSH traffic (port 22), or DNS queries (port 53). This helps in understanding application-level communication.
Examples include:
- Capture all HTTP traffic: `sudo tcpdump port 80`
- Capture SSH traffic on a specific host: `sudo tcpdump host 192.168.1.5 and port 22`
- Capture DNS queries: `sudo tcpdump port 53`
This capability is invaluable for debugging application connectivity or verifying service availability. It provides a clear view of which services are actively communicating.
Protocol-Based Filtering: TCP, UDP, ICMP, ARP, and More
Tcpdump supports filtering by various network protocols. This allows you to focus on specific layers of the network stack. Common protocols include TCP, UDP, ICMP, and ARP.
For instance, to see only ICMP (ping) traffic, you would use `sudo tcpdump icmp`. To view only TCP traffic, the command is `sudo tcpdump tcp`. This helps in isolating issues related to specific protocol behaviors.
Combining Filters with Logical Operators (AND, OR, NOT) for Precision
For highly specific captures, you can combine multiple filters using logical operators. The `and`, `or`, and `not` keywords allow for complex filtering expressions. Parentheses can group expressions, but they often need to be escaped or quoted in the shell.
Consider these advanced filtering examples:
- Traffic to or from host 192.168.1.100 on port 80: `sudo tcpdump ‘host 192.168.1.100 and port 80’`
- Traffic from 192.168.1.1 but not on port 22: `sudo tcpdump ‘src host 192.168.1.1 and not port 22’`
- DNS or HTTP traffic: `sudo tcpdump ‘port 53 or port 80’`
These combined filters enable extremely precise network analysis. They are essential for complex troubleshooting scenarios.
Advanced Tcpdump Command in Linux Techniques for Network Analysis
Beyond basic capture and filtering, the Tcpdump command in Linux offers advanced functionalities that significantly enhance its utility for in-depth network analysis. These techniques involve saving captures, reading files, and controlling output verbosity.
Saving Captured Packets to a File (`-w`) for Offline Analysis
Capturing live traffic can be overwhelming, and real-time analysis is not always feasible. Tcpdump allows you to save captured packets to a file using the `-w` option. This file can then be analyzed later with Tcpdump itself or other tools like Wireshark.
For example, `sudo tcpdump -i eth0 -w capture.pcap` will save all traffic from `eth0` to a file named `capture.pcap`. This approach is invaluable for long-term monitoring or when sharing capture data with colleagues. The `.pcap` extension is a common format for packet capture files.
Reading Packet Files (`-r`) and Analyzing Stored Data
Once you have a `.pcap` file, you can read and analyze its contents using Tcpdump with the `-r` option. This allows you to apply filters, just as you would with live traffic, but on the stored data. It’s perfect for post-mortem analysis.
To read the previously saved file, simply use `tcpdump -r capture.pcap`. You can also combine this with filters, such as `tcpdump -r capture.pcap ‘host 192.168.1.1 and port 80’`. This flexibility makes offline analysis as powerful as live capturing.
Limiting Packet Capture Size and Count for Efficiency
To prevent excessively large capture files or overwhelming output, Tcpdump provides options to limit the capture. The `-c` option specifies the number of packets to capture before stopping. Meanwhile, the `-s` option (snaplen) defines the maximum number of bytes to capture from each packet.
For instance, `sudo tcpdump -i eth0 -c 100` will capture only the first 100 packets. Using `sudo tcpdump -i eth0 -s 68` will capture only the first 68 bytes of each packet, which is often sufficient for header analysis. These options are crucial for efficient resource management.
Capturing Specific Packet Fields for Deeper Insight (e.g., `-X`, `-A`)
Tcpdump offers options to display more detailed information about the packet contents. The `-X` option prints the packet data in both hex and ASCII formats, which is useful for seeing the actual payload. The `-A` option prints each packet (minus its link level header) in ASCII.
For example, `sudo tcpdump -i eth0 -X port 80` will show the hex and ASCII dump of HTTP traffic. These options are particularly helpful for application-layer debugging or identifying specific data patterns within packets. They provide a deeper insight into the data being transmitted.
Interpreting Tcpdump Output and Troubleshooting
Understanding the output of the Tcpdump command in Linux is key to effectively troubleshooting network issues. The command provides a wealth of information, but it requires careful interpretation. This section helps you decipher common output fields and identify potential problems.
Understanding Common Output Fields: Timestamps, Source/Dest, Flags
A typical Tcpdump output line contains several crucial pieces of information. It usually starts with a timestamp, indicating when the packet was captured. Next, it shows the source and destination IP addresses and ports, followed by protocol-specific details.
For TCP packets, you will often see flags like `[S]` for SYN, `[.]` for ACK, `[F]` for FIN, and `[R]` for RST. These flags are vital for understanding the state of a TCP connection. Furthermore, sequence and acknowledgment numbers provide context for data flow. Learn more about Tcpdump on Wikipedia.
Identifying Network Issues: Latency, Dropped Packets, and Malicious Activity
By observing Tcpdump output, you can pinpoint various network problems. High latency might be indicated by significant time differences between request and response packets. Dropped packets can be inferred from retransmissions or incomplete TCP handshakes.
Moreover, unusual traffic patterns, such as numerous connection attempts to non-existent ports or unexpected protocols, could signal malicious activity. For example, a flood of SYN packets without corresponding ACKs might suggest a SYN flood attack. This makes Tcpdump a frontline tool for security monitoring.
Using Verbose Output (`-v`, `-vv`, `-vvv`) for Detailed Analysis
Tcpdump offers verbose options to display more detailed information about captured packets. The `-v` option provides slightly more detail, such as TTL and IP options. The `-vv` option adds even more, including NFS arguments and SMB headers.
The `-vvv` option provides the maximum level of verbosity, showing all available packet details. While this can generate a lot of output, it is invaluable for deep-dive analysis when specific header fields or protocol options need examination. Always start with less verbose options and increase as needed.
Tcpdump Alternatives and Best Practices
While the Tcpdump command in Linux is a powerful tool, it’s important to be aware of its alternatives and to follow best practices for its use. This ensures efficient and secure network analysis.
Comparison with Wireshark and Other Packet Analyzers
Wireshark is arguably the most well-known graphical packet analyzer and is often seen as an alternative to Tcpdump. Wireshark provides a user-friendly GUI, extensive protocol decoding, and advanced filtering capabilities. However, it requires a graphical environment and consumes more resources.
Tcpdump, being command-line based, is ideal for remote servers, scripting, and situations where a GUI is unavailable or impractical. Other tools like `tshark` (Wireshark’s command-line equivalent) or `ngrep` offer similar functionalities with different strengths. The choice often depends on the specific use case and environment.
Security Considerations When Using the Tcpdump Command in Production
Using Tcpdump, especially in promiscuous mode, has significant security implications. It can capture sensitive data, including passwords and private communications, if not encrypted. Therefore, it should be used with extreme caution on production systems.
Best practices include: running Tcpdump with minimal privileges (e.g., using `sudo` only when necessary), limiting capture to specific hosts or ports, and avoiding capturing sensitive data. Always ensure that capture files are stored securely and deleted after analysis. Furthermore, be mindful of disk space when performing long captures.
Optimizing Tcpdump Performance and Resource Usage
To optimize Tcpdump’s performance, especially on busy networks, consider using specific filters to reduce the amount of data processed. Limiting the snaplen (`-s`) can also significantly decrease CPU and memory usage. Additionally, redirecting output to a file (`-w`) is generally more efficient than printing to the console.
For very high-traffic environments, consider using specialized network monitoring hardware or tools designed for high-performance packet capture. However, for most Linux systems, intelligent use of the Tcpdump command in Linux with appropriate filters and options will provide excellent performance.
Frequently Asked Questions
What is the difference between tcpdump and Wireshark?
Tcpdump is a command-line packet analyzer, best suited for remote servers, scripting, and automated tasks without a graphical interface. Wireshark is a graphical packet analyzer that offers a rich user interface, extensive protocol decoding, and visual analysis tools. While Tcpdump captures traffic, Wireshark provides a more user-friendly way to analyze it, often by importing `.pcap` files generated by Tcpdump.
How can I capture traffic on a specific port with tcpdump?
To capture traffic on a specific port, you use the `port` keyword followed by the port number in your Tcpdump expression. For example, to capture all traffic on port 80 (HTTP), you would use `sudo tcpdump port 80`. You can also combine this with an interface specification like `sudo tcpdump -i eth0 port 80` for more targeted capture.
Is it safe to use tcpdump on a production server?
Using Tcpdump on a production server requires caution. While it’s a powerful diagnostic tool, running it in promiscuous mode can expose sensitive data if traffic is unencrypted. It’s recommended to limit captures to specific interfaces, hosts, or ports, avoid capturing sensitive data, and ensure capture files are stored securely and deleted promptly. Always consider the security implications and necessary permissions.
How do I save tcpdump output to a file and read it later?
You can save Tcpdump output to a file using the `-w` option, followed by the desired filename (e.g., `sudo tcpdump -i eth0 -w mycapture.pcap`). To read and analyze this file later, use the `-r` option: `tcpdump -r mycapture.pcap`. You can also apply filters when reading the file, just as you would with live captures.
Can tcpdump decrypt encrypted traffic like HTTPS?
No, Tcpdump itself cannot decrypt encrypted traffic like HTTPS, SSH, or VPN tunnels. It captures the encrypted packets as they appear on the wire. Decrypting such traffic typically requires access to the encryption keys and often involves specialized tools or techniques, which are beyond the scope of a basic packet sniffer. Tcpdump will show the encrypted payload but not its cleartext content.
Conclusion
The Tcpdump command in Linux stands as an indispensable tool for anyone involved in network administration, security, or development. Its ability to capture, filter, and analyze network traffic at a granular level provides unparalleled insight into network behavior. From basic troubleshooting to advanced security forensics, Tcpdump empowers users to diagnose and resolve complex network challenges effectively.
By mastering its syntax, filtering expressions, and advanced techniques, you gain a powerful capability to monitor and understand your network environment. Continued learning and practical application of this command will undoubtedly enhance your technical skillset. Start experimenting with the Tcpdump command in Linux today to unlock its full potential and take control of your network analysis!