Understanding how long a process takes to execute is crucial for system optimization and debugging in Linux environments. The Linux Time Command is an indispensable utility that provides detailed insights into the resource consumption of a given command or script. It helps developers and system administrators analyze performance, identify bottlenecks, and make informed decisions about code efficiency. Before diving in, let’s clarify what the Linux Time Command actually means and why it’s so vital.
Understanding the Linux `time` Command Basics
The `time` command in Linux is a powerful tool designed to measure the execution time of other commands. It reports statistics about the resources consumed by a program during its run. This includes not only the wall-clock time but also the CPU time spent in user mode and kernel mode. Therefore, it offers a comprehensive view beyond simple stopwatch measurements.
What is the `time` command and why use it?
The `time` command essentially acts as a performance monitor for individual commands. It allows you to quantify how much time a specific process spends using the CPU and how much time passes from its start to its finish. You should use it to benchmark scripts, compare different implementations of an algorithm, or troubleshoot slow applications. Furthermore, it’s excellent for understanding the efficiency of your system’s resource allocation.
Basic-syntax-and-execution-of-the-time-command">Basic Syntax and Execution of the `time` Command
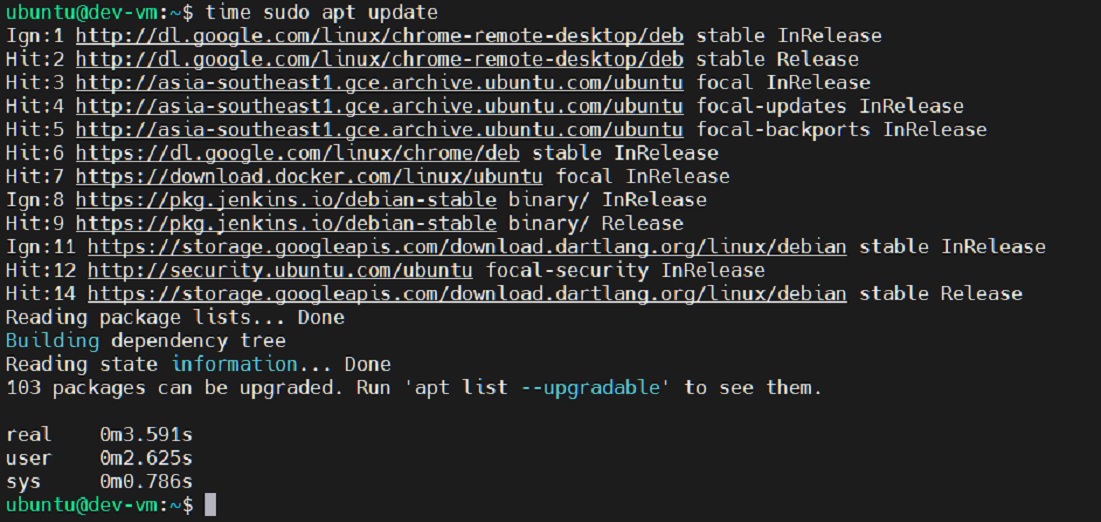
Using the `time` command is straightforward. You simply prepend `time` to the command you wish to measure. For example, to time how long it takes to list files in a directory, you would type `time ls -l`. The output will then display various time metrics after the `ls` command completes. Remember that the shell built-in `time` might differ slightly from `/usr/bin/time` in its features and output format.
Default Output of the `time` Command Explained
By default, the `time` command provides three key metrics: real, user, and sys time. These values are fundamental for performance analysis. Real time is the actual elapsed time from start to finish, akin to a stopwatch. User time represents the CPU time spent executing user-level code. Sys time, conversely, is the CPU time spent executing kernel-level code on behalf of the process. Understanding these distinctions is paramount for effective analysis.
Interpreting `time` Command Output Metrics
Delving deeper into the output of the Linux Time Command reveals more granular details about process execution. Each metric tells a unique story about how your program interacts with the system. Properly interpreting these values can lead to significant performance improvements. Thus, a thorough understanding of each component is essential for any serious optimization effort.
Real, User, and Sys Time: A Detailed Breakdown
The ‘real’ time includes all factors, such as I/O waits and other processes running concurrently. ‘User’ time reflects the CPU cycles dedicated to the program’s instructions. ‘Sys’ time indicates the CPU cycles spent on system calls and kernel operations. A high ‘real’ time compared to ‘user’ + ‘sys’ time often suggests I/O bottlenecks or waiting for external resources. Conversely, if ‘user’ + ‘sys’ is close to ‘real’, the program is likely CPU-bound.

Understanding CPU Utilization and Resource Usage with `time`
Beyond the core time metrics, the `time` command can also report on CPU utilization. This is often expressed as a percentage, indicating how much of the CPU’s capacity the process consumed. A high percentage suggests intensive computation, while a low percentage might point to waiting states. Additionally, it can show memory usage, including maximum resident set size. This helps in assessing the overall resource footprint of your commands.
Customizing Output Formats for the `time` Command
The `time` command offers options to customize its output, providing more specific data points. You can use the `-f` (format) option with various specifiers to tailor the information displayed. This flexibility allows you to focus on the metrics most relevant to your analysis. For instance, you might want to see page faults or average memory usage. You can find a comprehensive list of format specifiers in the `time` command’s man page.
Here are some common format specifiers:
- `%e`: Elapsed real time (in seconds).
- `%U`: User CPU time (in seconds).
- `%S`: System CPU time (in seconds).
- `%P`: Percentage of the CPU that this job got.
- `%M`: Maximum resident set size of the process during its lifetime (in kilobytes).
Practical Applications of the Linux `time` Command
The versatility of the Linux Time Command extends to numerous practical scenarios in system administration and software development. It serves as a first-line diagnostic tool for performance issues. Leveraging its capabilities can significantly streamline your workflow and improve the efficiency of your Linux systems. Therefore, integrating `time` into your daily toolkit is highly recommended.
Benchmarking Script and Program Execution Times
One of the primary uses of the `time` command is for benchmarking. You can run different versions of a script or program and compare their execution times directly. This helps in identifying which version performs better under specific conditions. For example, you might benchmark various sorting algorithms to see which is fastest for a given dataset. This iterative process is crucial for performance tuning.
Identifying Performance Bottlenecks with the `time` Command
When a program runs slower than expected, the `time` command can help pinpoint where the delays are occurring. If ‘real’ time is significantly higher than ‘user’ + ‘sys’ time, it suggests the program is spending a lot of time waiting. This waiting could be due to I/O operations, network latency, or contention for resources. Further investigation with other tools can then target these specific bottlenecks.
Monitoring Resource Consumption for Linux Processes
Beyond just time, the `time` command provides insights into other resource consumption, such as memory. By observing the maximum resident set size, you can gauge the memory footprint of your applications. This is particularly useful for resource-constrained environments or when optimizing for memory efficiency. Monitoring these metrics helps ensure your processes are not consuming excessive system resources.
Key areas for monitoring include:
- CPU usage for computationally intensive tasks.
- Memory footprint for applications dealing with large datasets.
- I/O wait times for disk-heavy operations.
Advanced `time` Command Usage and Options
While the basic usage of the `time` command is simple, its advanced features unlock even greater analytical power. Understanding these options allows for more precise measurements and better integration into complex workflows. Mastering these techniques will elevate your performance analysis capabilities. This section explores some of the more sophisticated aspects of the `time` command.

Using `time` with Shell Built-ins and Functions
It’s important to distinguish between the shell built-in `time` and the external `/usr/bin/time` utility. The shell built-in typically offers fewer features but is faster to execute. To ensure you’re using the external command with its full range of options, you can specify its full path: `/usr/bin/time`. This is especially relevant when using advanced formatting options or integrating `time` into scripts where consistency is key.
automation">Integrating the `time` Command into Scripts for Automation
The `time` command can be seamlessly integrated into shell scripts to automate performance measurements. You can capture its output and parse it for automated reporting or conditional logic. For instance, a script could run a daily backup, time it, and alert you if the execution time exceeds a certain threshold. This enables proactive monitoring and performance management without manual intervention.
Consider these steps for script integration:
- Use `/usr/bin/time -f “format_string”` to get specific output.
- Redirect standard error (where `time` outputs) to a file or variable.
- Parse the output to extract relevant metrics.
- Implement logic based on measured performance.
Exploring `time` Command Environment Variables and Configuration
The behavior of the `time` command can also be influenced by environment variables, particularly for the external `/usr/bin/time` version. For example, the `TIME` environment variable can be used to set a default format string. This allows for consistent reporting across multiple commands without repeatedly specifying the `-f` option. Consult the man page for `time` for a complete list of supported environment variables and their effects. For more detailed information on Linux commands, you can refer to resources like Wikipedia on GNU Core Utilities. GNU Core Utilities.
`time` Command vs. Other Linux Performance Tools
While the `time` command is excellent for quick execution measurements, Linux offers a suite of other powerful performance analysis tools. Each tool serves a distinct purpose and provides different levels of detail. Understanding when to use the `time` command versus these alternatives is crucial for effective system diagnostics. Therefore, knowing their strengths and weaknesses helps in choosing the right tool for the job.
Comparing `time` with `perf` for Deeper Analysis
`perf` is a much more sophisticated profiling tool that can delve into CPU performance counters, cache misses, and system calls. While `time` gives you an overview of total execution time, `perf` provides granular data on why a program is taking that time. Use `time` for initial benchmarking and `perf` for deep-dive analysis into CPU-bound issues. `perf` requires more setup and understanding but yields incredibly detailed insights.
When to Use `time` vs. `strace` for System Call Tracing
`strace` is used to trace system calls and signals. It shows you every interaction a program has with the Linux kernel, including file operations, network connections, and memory allocations. If you suspect a program is failing due to incorrect system calls or is spending too much time on specific kernel operations, `strace` is the tool. The `time` command, however, will only tell you the cumulative system time spent. `strace` is for debugging behavior, while `time` is for measuring overall performance.
Distinguishing `time` from `top` or `htop` for Real-time Monitoring
`top` and `htop` are interactive utilities for real-time monitoring of running processes. They show CPU usage, memory consumption, and other metrics for all active processes on your system. The `time` command, in contrast, measures only a single command’s execution from start to finish. Use `top`/`htop` to get a snapshot of overall system health and identify resource hogs. Use `time` to precisely measure the performance of a specific, isolated task.
Frequently Asked Questions about the Linux `time` Command
How can I get more precise timing with the `time` command?
For more precise timing, especially for very fast commands, you should use the external `/usr/bin/time` command with its full path. Additionally, you can specify format strings (e.g., `-f “%e”`) to get output in seconds with higher precision. Running the command multiple times and averaging the results can also help mitigate measurement noise, providing a more reliable benchmark.
Can the `time` command measure network latency or I/O performance?
The `time` command itself doesn’t directly measure network latency or specific I/O throughput. However, its ‘real’ time metric will reflect the impact of these factors on the overall execution duration. If ‘real’ time is significantly higher than ‘user’ + ‘sys’ time, it often indicates I/O or network waits. For detailed network or I/O performance metrics, you would need specialized tools like `ping`, `iperf`, `iostat`, or `iotop`.
What’s the difference between `/usr/bin/time` and the shell built-in `time`?
The primary difference lies in their features and implementation. The shell built-in `time` (available in Bash, Zsh, etc.) is simpler, faster, and typically outputs only the basic real, user, and sys times. The external `/usr/bin/time` program is a standalone executable that offers more advanced features, such as custom output formatting with the `-f` option and detailed resource statistics. For comprehensive analysis, always prefer `/usr/bin/time`.
Conclusion: Mastering the Linux `time` Command for Performance Optimization
The Linux Time Command is a fundamental utility for anyone working with Linux systems. It provides crucial insights into the execution time and resource consumption of commands and scripts. By understanding its output, from real, user, and sys times to CPU utilization, you can effectively benchmark applications and pinpoint performance bottlenecks. Integrating this command into your analytical toolkit empowers you to write more efficient code and manage system resources more effectively.
Embrace the power of the `time` command to optimize your workflows and enhance your understanding of process behavior. Start using it today to measure, analyze, and improve the performance of your Linux applications. What command will you time first to uncover hidden efficiencies?