Are you looking to establish a robust monitoring solution for your Ubuntu servers? Learning how to install Prometheus Grafana Ubuntu is a fundamental step for any system administrator or developer. This comprehensive guide will walk you through setting up a powerful monitoring stack, enabling you to gain deep insights into your system’s performance and health. By the end, you will have Prometheus collecting metrics and Grafana visualizing them beautifully on your Ubuntu machine.
Understanding Monitoring with Prometheus & Grafana on Ubuntu
Prometheus and Grafana form a dynamic duo for server monitoring. Prometheus acts as the data collection and storage engine, pulling metrics from various sources. It is renowned for its powerful query language, PromQL, which allows for complex data analysis. Therefore, understanding its core function is crucial for effective monitoring.
Key Components of the Monitoring Stack
This monitoring stack relies on several interconnected components. Each plays a vital role in gathering, storing, and presenting your server data. Furthermore, these components work together seamlessly to provide a complete overview of your system. Here are the primary elements:
Prometheus Server: This component scrapes metrics from configured targets and stores them. It is the heart of your monitoring system.
Node Exporter: A lightweight agent running on your Ubuntu server, exposing hardware and OS metrics. It provides essential data like CPU usage, memory, and disk I/O.
Grafana: A powerful open-source platform for data visualization and analytics. It allows you to create interactive dashboards using data from Prometheus.
Ubuntu Operating System: The stable and popular Linux distribution serving as the foundation for our installation.
Preparing Your Ubuntu System for Installation
Before you install Prometheus Grafana Ubuntu, it is essential to prepare your system properly. This ensures a smooth installation process and prevents common issues. A well-prepared environment is the cornerstone of a stable monitoring setup. Therefore, we will begin with system updates and user creation.
Updating System Packages and Installing Dependencies
First, always update your package list and upgrade existing packages. This ensures you have the latest security patches and software versions. Additionally, we will install some necessary dependencies that Prometheus and Grafana require. Use the following commands in your terminal:
Creating Dedicated Users and Configuring Firewall (UFW)
For security and better resource management, it is best practice to create dedicated system users for Prometheus and Node Exporter. These users will run the respective services with minimal privileges. Furthermore, configuring your firewall (UFW) is crucial to allow necessary traffic. Here’s how to set up users and UFW rules:
Allow Prometheus port (9090): `sudo ufw allow 9090/tcp`
Allow Grafana port (3000): `sudo ufw allow 3000/tcp`
Allow Node Exporter port (9100): `sudo ufw allow 9100/tcp`
Enable UFW: `sudo ufw enable` (confirm with ‘y’)
Installing Prometheus Server on Ubuntu
Now, let’s proceed with the core task to install Prometheus Grafana Ubuntu by setting up Prometheus itself. We will download the pre-compiled binaries, extract them, and configure Prometheus to run as a systemd service. This ensures Prometheus starts automatically upon server reboot. It is a straightforward process.
Downloading and Setting Up Prometheus Binaries
Prometheus provides pre-compiled binaries, simplifying the installation. We will download the latest stable version directly from the official Prometheus website. After downloading, we will extract the files and move them to their appropriate locations. This ensures proper system integration.
Download Prometheus: `wget https://github.com/prometheus/prometheus/releases/download/v2.48.0/prometheus-2.48.0.linux-amd64.tar.gz` (Check Prometheus Downloads for the latest version)
Set ownership: `sudo chown prometheus:prometheus /usr/local/bin/prometheus /usr/local/bin/promtool /etc/prometheus /var/lib/prometheus`
Configuring and Starting Prometheus as a Systemd Service
Next, we need to configure Prometheus and set it up as a systemd service. This allows for easy management (start, stop, enable) of the Prometheus server. First, copy the default configuration file and then create a systemd service file. This ensures Prometheus runs reliably in the background.
Edit `/etc/prometheus/prometheus.yml` to include a scrape target for itself. Then, create `/etc/systemd/system/prometheus.service` with the following content:
[Unit]
Description=Prometheus
Wants=network-online.target
After=network-online.target
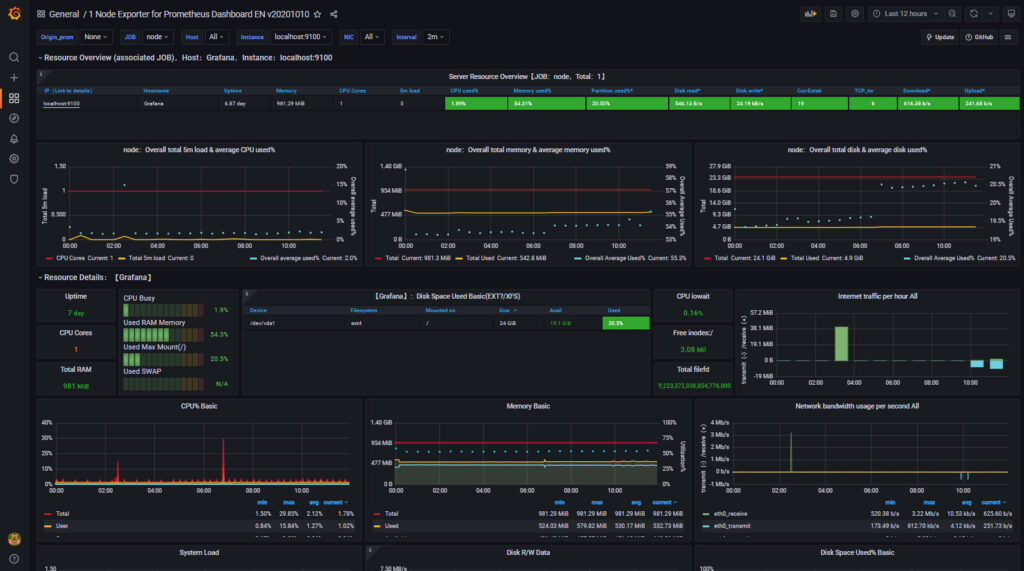
Photo from Search Engines (https://sbcode.net/grafana/img/prometheus-dashboard.jpg)
To fully utilize your monitoring stack, you must integrate Node Exporter. This tool collects vital metrics directly from your Ubuntu server. It exposes these metrics on a specific port, which Prometheus can then scrape. This step is crucial for gaining visibility into your server’s health.
Installing and Configuring Node Exporter on Ubuntu
Similar to Prometheus, Node Exporter is available as a pre-compiled binary. We will download, extract, and set it up to run as a systemd service. This ensures continuous metric collection. Follow these steps to install and configure Node Exporter:
Download Node Exporter: `wget https://github.com/prometheus/node_exporter/releases/download/v1.7.0/node_exporter-1.7.0.linux-amd64.tar.gz` (Check Node Exporter Releases for the latest version)
Updating Prometheus Configuration to Scrape Node Exporter
With Node Exporter running, Prometheus needs to know where to find its metrics. We will edit the Prometheus configuration file (`/etc/prometheus/prometheus.yml`) to add Node Exporter as a scrape target. This tells Prometheus to regularly pull data from the Node Exporter. Remember to reload Prometheus after making changes.
Add the following job under the `scrape_configs` section in `/etc/prometheus/prometheus.yml`:
Installing Grafana for Data Visualization on Ubuntu
After successfully setting up Prometheus and Node Exporter, the next crucial step is to install Prometheus Grafana Ubuntu by installing Grafana. Grafana provides the visual interface to interpret the metrics collected by Prometheus. It transforms raw data into understandable and actionable dashboards. This makes monitoring much more intuitive.
Adding Grafana APT Repository and Installing Package
Grafana maintains its own APT repository, making installation and updates straightforward. We will add this repository to your system, import its GPG key, and then install Grafana using `apt`. This is the recommended method for installing Grafana on Ubuntu. It ensures you receive official updates.
Add repository: `echo “deb [signed-by=/usr/share/keyrings/grafana.key] https://apt.grafana.com stable main” | sudo tee -a /etc/apt/sources.list.d/grafana.list`
Update apt: `sudo apt update`
Install Grafana: `sudo apt install grafana -y`
Starting and Enabling the Grafana Server
Once installed, Grafana needs to be started and enabled as a systemd service. This ensures it runs in the background and automatically restarts if your server reboots. You can then access the Grafana web interface through your browser. Use these commands to manage the Grafana service:
Check status: `sudo systemctl status grafana-server`
Connecting Grafana to Prometheus and Building Dashboards
With Grafana installed, the final step to fully install Prometheus Grafana Ubuntu is to connect them. This allows Grafana to query and visualize the metrics stored in Prometheus. You will then be able to create powerful dashboards. This integration unlocks the full potential of your monitoring stack.
Accessing Grafana UI and Adding Prometheus Data Source
Open your web browser and navigate to `http://YOUR_SERVER_IP:3000`. The default login credentials are `admin` for both username and password. You will be prompted to change the password on first login. After logging in, navigate to “Configuration” -> “Data Sources” and add a new Prometheus data source. Set the URL to `http://localhost:9090` and click “Save & Test”.
Importing and Customizing Your First Monitoring Dashboard
Grafana offers a vast library of pre-built dashboards that you can import. For Node Exporter, a popular dashboard is ID 1860. Go to “Dashboards” -> “Import”, enter `1860`, and click “Load”. Select your Prometheus data source and click “Import”. You now have a comprehensive dashboard visualizing your Ubuntu server metrics. You can further customize this dashboard to suit your specific needs, adding or removing panels as required.
Troubleshooting Common Issues and Best Practices
Even with a detailed guide, you might encounter minor issues during installation. Knowing how to troubleshoot these problems can save significant time. Furthermore, adopting best practices ensures the long-term stability and security of your monitoring setup. Always check logs first when problems arise.
Diagnosing Service Errors and Firewall Problems
If a service fails to start, check its systemd status and journal logs. For example, `sudo systemctl status prometheus` or `sudo journalctl -u prometheus`. Firewall issues are also common; ensure ports 9090, 9100, and 3000 are open. Use `sudo ufw status` to verify your UFW rules. Incorrect file permissions can also cause services to fail, so double-check ownership.
Securing Your Prometheus and Grafana Setup
Security is paramount for any production system. Change default Grafana passwords immediately. Consider using a reverse proxy like Nginx or Apache with SSL for secure access to Grafana. Implement strong authentication and authorization for Grafana users. Additionally, restrict access to Prometheus and Node Exporter ports to trusted IPs only. Regularly update all components to patch known vulnerabilities.
Frequently Asked Questions
What are the system requirements for this setup?
A minimal Ubuntu server with at least 1GB RAM and 20GB disk space is generally sufficient for Basic monitoring. However, resource requirements scale with the number of metrics collected and the retention period. For production environments, consider more robust hardware. CPU usage is typically low, but disk I/O can increase with high metric churn.
How do I keep Prometheus and Grafana updated on Ubuntu?
For Prometheus and Node Exporter, you will need to manually download the latest binaries and replace the old ones, then restart their respective systemd services. For Grafana, since we used the APT repository, simply run `sudo apt update && sudo apt upgrade grafana -y`. This ensures you benefit from the latest features and security fixes.
Can I monitor remote servers with this guide?
Yes, absolutely! To monitor remote servers, you would install Node Exporter on each remote Ubuntu server you wish to monitor. Then, you would update your main Prometheus server’s `/etc/prometheus/prometheus.yml` file to include the IP addresses and port 9100 of those remote Node Exporter instances. Ensure your firewall allows Prometheus to scrape the remote Node Exporters.
Conclusion: Empowering Your Ubuntu Monitoring with Prometheus & Grafana
You have successfully learned how to install Prometheus Grafana Ubuntu, establishing a powerful and flexible monitoring solution. This setup provides invaluable insights into your server’s performance and health. By following these steps, you’ve built a solid foundation for proactive system management. This empowers you to detect and address issues before they impact users. Furthermore, this knowledge is highly transferable to other monitoring challenges.
Recap of Your Successful Monitoring Stack Installation
We covered preparing your Ubuntu system, installing and configuring Prometheus, integrating Node Exporter for host metrics, and finally, installing Grafana for visualization. You now have a fully operational monitoring stack. This robust system will help you maintain optimal performance and reliability for your Ubuntu servers. It truly represents a significant upgrade to your operational capabilities.
Next Steps for Advanced Monitoring and Alerting
With your basic setup complete, consider exploring advanced features. You can configure Prometheus Alertmanager for notifications on critical events. Additionally, delve deeper into PromQL to create custom queries and dashboards. Explore other Prometheus exporters for specific applications like databases or web servers. Continue learning and optimizing your monitoring strategy; the possibilities are extensive!
Zac Morgan is a DevOps engineer and system administrator with over a decade of hands-on experience managing Linux and Windows infrastructure. Passionate about automation, cloud technologies, and sharing knowledge with the tech community. When not writing tutorials or configuring servers, you can find Zac exploring new tools, contributing to open-source projects, or helping others solve complex technical challenges.